JLL Office Property Clock: Highest Vacancy rate in almost 10 years despite accelerating office rental growth in Europe
For a number of years, European labor markets have experienced an upward curve with rising employment, low unemployment and a return to positive real wage growth. This has rubbed off on the office property market, which has grown positively over the years and is still experiencing accelerating growth to some extent.
Joseph Alberti, Head of Research at EDC Commercial Poul Erik Bech, says: “The office rent index in Europe saw a significant increase in Q3 2024 of 2.7% from the previous quarter. This is the largest quarterly development since Q2 2006 and significantly higher than the Year 10 average of 1%. The annual rental growth for the European office market is 6.9%, the fastest increase since Q1 2008 and significantly above the 10-year average of 3.9%.”
“Escalator clauses were recorded in 16 out of 23 index markets, with notable office metropolises such as London and Paris seeing increases from last quarter of 5% and 4% respectively. Compared to rental activity a year ago, there has been a modest increase of 1%, while there has been a slight decrease of 8% in rental activity,” says Joseph Alberti.
Highest Vacancy rate since 2015
In Q3 2024, the Vacancy rate for offices in Europe reached 8.5%, which is the highest level since 2015. Across the 23 index markets, 16 of them recorded an increase in Vacancy rates compared to the previous quarter. German and Dutch cities recorded the largest increases in vacancy rates, with Berlin, Düsseldorf, Frankfurt, Amsterdam and The Hague, among others, seeing the largest increases.
Helle Nielsen Ziersen, Head of EDC International Poul Erik Bech, says: “At a European level, there has been an increase in the vacancy rate for offices in 2024, which can largely be attributed to a change in companies’ requirements for an office. More and more companies have become more discerning and are looking for new, state-of-the-art offices, increasing the supply of low-quality buildings. In addition, the uncertainty of the last few years has limited corporate expansion, meaning that not nearly as many new offices have opened across borders as we have seen in the past.”
“It’s the same thing we experience when we work with Danish companies travelling abroad or international companies looking for office space in Denmark. The last few years have seen a decline in numbers, but there are indications that things will brighten up a bit in 2025. However, it’s also worth noting that the Vacancy rate for offices in Copenhagen also increased in Q4 2024 to 7.2%, which is the highest level since 2022,” says Helle Nielsen Ziersen.
Copenhagen at the top of the clock
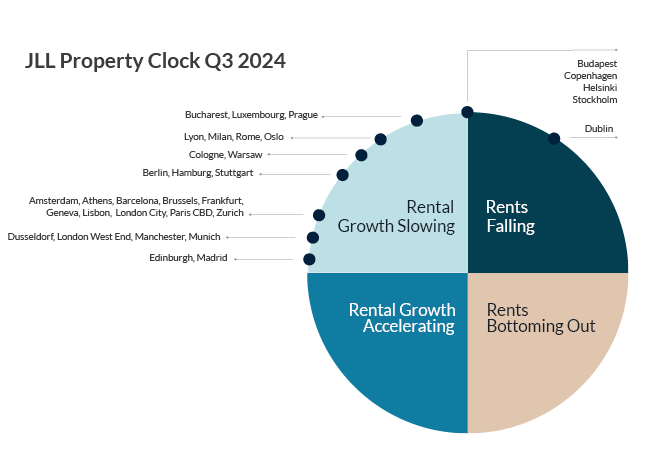
Copenhagen sits at the top of the Property Clock alongside our Scandinavian neighbors Helsinki and Stockholm, among others. While the newly built and modern buildings are experiencing rising rental prices, they are also complicit in increasing vacancy rates as supply increases and companies vacate outdated and older office space.
Joseph Alberti said: “Copenhagen is at the top of JLL’s Property Clock between slow rental growth and falling rents, along with Budapest, Helsinki and Stockholm. Copenhagen is split in two, with the new modern offices where demand is high, and the older offices where demand is not so high, so therefore Copenhagen has landed between two chairs, with rent growth expected to follow Inflation at around 2% in the near future.”
Helle Nielsen Ziersen adds: “In Denmark, we still have an extremely high employment rate and the commute time to the big office cities is somewhat shorter, so we still have an optimistic office market. However, there has been a development, and it has become more important than ever to be close to public transport and metro systems to make it as easy as possible for employees to get to and from work. It’s a completely different world in the large European metropolises like London, Paris, and Madrid, where working from home has become more common over the past few years, and offices are therefore not as highly valued as we experience, for example, in Copenhagen.”

Source: JLL
The JLL Property Clock illustrates the position of European office markets within their rental cycle. While markets typically move clockwise, they can shift in either direction. Markets on the left side are generally more favorable for lessors, whereas those on the right tend to favor tenants. The diagram serves as a practical tool for comparing the relative positions of markets in their rental cycles. However, the positions do not necessarily reflect investment or development market prospects but rather indicate primary headline rental values. Markets with a “step pattern” of rental growth often deviate from traditional cycles, typically oscillating only between the “hours” of 9 and 12, where 9 o’clock represents a sudden increase in rent levels following a period of stability.
